


Where can I find the latest cancer statistics?
We receive quite a few cancer research papers to edit, and it is not uncommon for authors to set the scene by presenting a few ‘critical’ cancer facts (such as incidence, prevalence, and mortality) in the opening lines of the introduction. There is nothing wrong with this (although we wouldn’t necessarily advise it if you are submitting to a highly specialised cancer journal), but it is important that the figures are correct. We often find that the ‘facts’ are, more often than not, wildly out of date, inaccurate, or incompletely referenced. Given the easy accessibility of online data, there really is no excuse for glaring inaccuracies and any sloppiness could irritate a reviewer.
That’s why we suggest that you visit GLOBOCAN, an online resource established and maintained by the International Agency for Research on Cancer (part of the WHO). The GLOBOCAN project provides current estimates of the incidence, mortality, and prevalence of major cancer types for 184 countries. The data can be separated by sex, and 1-, 3-, and 5-year prevalence data are available for the adult population.
The database is particularly useful since it can be queried using online analysis tools, which allow you to produce graphs, tables, and maps to illustrate data. These tools are likely to be particularly useful for theses and dissertations, where there is often a need to provide more comprehensive background to the subject and provide basic data.
For instance, let’s say that you need to prepare a graph that compares age-standardised incidence and mortality rates of female cancers in ‘developed’ and ‘developing’ regions. Easy!
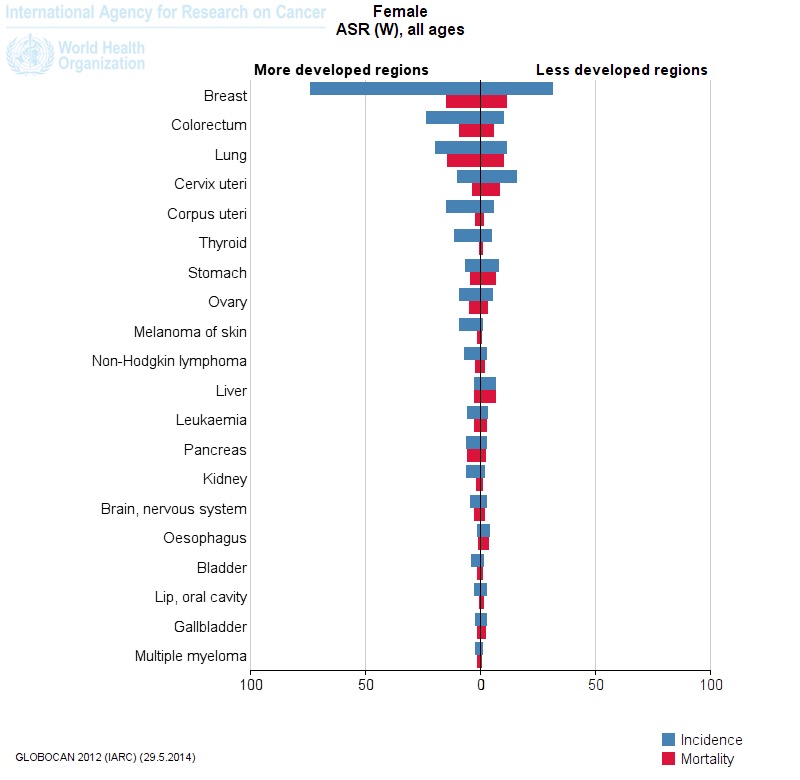
The graph clearly highlights those cancers that persist as first-world problems, such as breast cancer, and those cancers that more commonly affect women in the developing world (such as cervical cancer). This might provide an excellent starting point for a discussion about the epidemiology of these diseases.
GLOBOCAN can be referenced in your manuscript, and there is a useful glossary of terms, just in case you tend to get your ‘incidences’ and ‘prevalences’ mixed up. Of course, there are other excellent statistical resources available to cancer researchers, such as CRUK’s Cancer Stats resource in the UK or the NCI’s tools in the US. Please let us know if you know of any other resources that you find useful by commenting below!
comments powered by Disqus
That’s why we suggest that you visit GLOBOCAN, an online resource established and maintained by the International Agency for Research on Cancer (part of the WHO). The GLOBOCAN project provides current estimates of the incidence, mortality, and prevalence of major cancer types for 184 countries. The data can be separated by sex, and 1-, 3-, and 5-year prevalence data are available for the adult population.
The database is particularly useful since it can be queried using online analysis tools, which allow you to produce graphs, tables, and maps to illustrate data. These tools are likely to be particularly useful for theses and dissertations, where there is often a need to provide more comprehensive background to the subject and provide basic data.
For instance, let’s say that you need to prepare a graph that compares age-standardised incidence and mortality rates of female cancers in ‘developed’ and ‘developing’ regions. Easy!
The graph clearly highlights those cancers that persist as first-world problems, such as breast cancer, and those cancers that more commonly affect women in the developing world (such as cervical cancer). This might provide an excellent starting point for a discussion about the epidemiology of these diseases.
GLOBOCAN can be referenced in your manuscript, and there is a useful glossary of terms, just in case you tend to get your ‘incidences’ and ‘prevalences’ mixed up. Of course, there are other excellent statistical resources available to cancer researchers, such as CRUK’s Cancer Stats resource in the UK or the NCI’s tools in the US. Please let us know if you know of any other resources that you find useful by commenting below!
comments powered by Disqus
Open source software for scientists - our top five recommendations
As part of our drive to help reduce barriers to scientific publishing, today we would like to share Nextgenediting’s top five open source or free alternatives to commercial scientific software packages. Although the vast majority of the submissions we receive are written in Microsoft Word with citations embedded using Endnote, we also use the freely available programs listed below to help edit and prepare papers for submission. This has become even more important as we liaise with scientists from low- and middle-income countries as part of the Global Initiative, who sometimes cannot afford the (sometimes extremely) high cost of commercial software. Please let us know if you have any other recommendations or questions about the use of these packages.
1. Image processing and manipulation - GIMP (The GNU Image Manipulation Program)
GIMP is a fantastic and versatile alternative to Adobe Photoshop, feely downloadable for all platforms (Mac, Windows, Linux, and others). We find it particularly useful for image conversion in preparation for manuscript submission, especially for producing the high-resolution 300 dpi figures frequently required by the journals. Although the learning curve is relatively steep, there is comprehensive online documentation (including in multiple languages) that holds your hand through basic tasks, such as image re-sizing, cropping, and how to add text to figures. Although CMKY is not supported, we use the Separate+ plugin when conversion is necessary. Give it a try!
2. Statistical analysis - PSPP
Although SPSS is probably the dominant statistical analysis software package used in the social and life sciences, its high cost and annual license fees make it inaccessible to many researchers and students, particularly those already working in under-resourced environments. Although R is a phenomenally powerful (and free) statistical programming environment, it can be difficult to learn due to the lack of an intuitive graphical interface and need to grasp a new programming language (great in theory, just not going to happen in practice for most of us). PSPP is an open source alternative to SPSS that is certainly worth a shot. It is limited to basic analyses - descriptive statistics, linear regression, t-tests, and the like - but those familiar with the SPSS interface will have no problems using it since it is almost identical. If more people start to use it, perhaps we will see development of more complex functions.
3. Citation management - Bibus
Learning how to use citation management/bibliographic software is a must for academics. The proprietary software packages are not usually prohibitively expensive, but it would be wise to check with your institution first to see whether they have cheaper institutional licensing arrangements and training courses available. However, what about a free alternative? We recommend Bibus, a powerful reference management software package that integrates with MS Word and OpenOffice and allows online searching of PubMed via an intuitive user interface. One drawback though - while you can get Bibus to work on a Mac, it does not currently integrate with Word for Mac.
4. Typesetting and word processing - LaTeX
The scientific community is, without doubt, tied down to MS Word for document preparation and that is unlikely to change in the near future. The transition to any other word processing program can seem daunting, and most of us who have tried have generally failed. OpenOffice.org is a free alternative to MS Office and, as explained above, can be used with citation management software to good effect. However, LaTeX, another powerful ‘programming language’, might be worth exploring if you are embarking on a large document that requires a professional finish, such as a thesis. LaTeX produces documents with superior typesetting and is particularly useful if the document contains a lot of maths. It is free and easily extensible (see the Comprenhesive TeX Archive Network, CTAN). It does take some getting used to because it is not WYSIWYG, but consider it if you are about to undertake a ‘long-haul’ project. See also the great resource from the Department of Engineering at the University of Cambridge to help you get started with LaTeX.
5. Open Access (OA) article searching - CORE Research Mobile App (for iOS and Android)
Sometimes finding the data can be as difficult as processing it, especially when a lot of papers are still hidden behind paywalls. We recently found this nifty app from the UK’s Open University, which allows you to search and download freely available, full-text articles and read them on your device (in another app of your choosing, such as Kindle). The repository currently contains over 18 million open access articles. A great place to look if you need to find full text to support your research and don’t have access to journal subscriptions.
So there we are - our top five open source software packages for scientists - but please suggest your own too using the comments box below.
comments powered by Disqus
Editing by numbers
28/08/13 16:33 Filed in: General | Manuscript Editing | Cost of Manuscript Editing | Nextgenediting | Value for money
We’ve already written about why we think hiring the services of our editors represents excellent value for money, especially when you take your own (very valuable) time into account. Nevertheless, we know that taking the plunge and sending us your paper can be a bit of a leap into the unknown, especially for people who haven’t used this type of service before. Will they be any good? How long will they spend on my paper? Will I be pleased with the results? How can I trust them? There are some pointers here to help you come to a decision, courtesy of Nature, and you can read about what we’re doing to deliver the best possible service here.
However, we also thought it might be useful to share some of our own data with you, generated from real papers that our customers have sent to us. We decided to audit fifty manuscripts submitted to us for editing in early 2013 in order to paint a picture of what you can expect from us.
This is “Nextgenediting by numbers*”:
Total number of words: 195 684
Average number of corrections per manuscript: 1042
Average number of words written as comments by our editors: 428
Average number of formatting changes per manuscript: 102
Average time taken editing each line: 32 seconds
Highest impact factor journal: 25**
Average impact factor of intended journal: 3.2
Lowest impact factor journal: 1.3**
Number of authors failing to get published: 0***
* fifty consecutive manuscripts submitted to Nextgenediting for full editing.
** Verified published by Pubmed citation.
*** At time of writing, and according to available data and feedback from clients.
Thirty-two seconds spent editing each line of text (of approximately 10 words). Thirty-two seconds of expert scientist or clinician reading your carefully crafted words, and then sculpting them some more. That’s quite a long time. Take a look for yourself by playing this video:
Of course, these data are not without their limitations - variability between editors, variability in the quality of submitted work, and the limitations of the tracking data generated by MS Word, to name a few. The acid test is whether our customers are happy. So let’s give you one or two more numbers:
53% of those papers were from repeat customers. And 20% of those customers have submitted three or more papers for editing. That’s how pleased they are, and you can read some of their reviews here.
We know you won’t be disappointed if you choose Nextgenediting. Submit your manuscript now.
comments powered by Disqus
The World Databank - An Amazing Resource
20/02/13 13:01 Filed in: General | Nextgenediting Global Initiative | Data | Bioinformatics | Gene Expression Analysis | World Databank
Something we feel strongly about at Nextgenediting is the use of computational biology to support and contextualise the main experimental findings of a biological paper. There is a wealth of primary research that can be performed before you even get started doing your experiments in the lab, and the best papers know how to make the best use of it. These data can be particularly useful for grant applications, too. We sometimes send recommendations back to our biomedical authors saying ‘go to GEO and analyse this dataset - you have all the information available to you tell you exactly what the expression of your gene of interest is in thousands of breast cancers…or colon cancers…or cardiovascular patients….or whatever your disease of interest is’. When you take this approach you often find the experiment you were planning (in vitro or in vivo) has already been performed, or there is supporting mouse data, or often clinical data. They can be used to generate the first figure(s) of the paper, put the experimental data in clinical context, and save a huge amount of time and effort performing costly -omics experiments. If you don’t know how to use these resources or need more information, please contact us.
What we hadn’t realised until very recently was that the same can be done for epidemiological data. We are currently planning our Nextgenediting Global Initiative (for more information click here), and while researching health and income statistics of third-world countries we found the World Bank World Databank. This is a free, online database of Development Indicators, Gender Statistics, and other useful data, which you can mine and interrogate at will for hundreds of different countries - both developed and otherwise. Most exciting for us however, is the Health, Nutrition, and Population Statistics Database which allows you to mine health and disease-related data. You just choose your country or countries of interest, the data series you want, and the range of years you are comparing (from 1961 to present) and the results are presented as tables, graphs, or on a map. You can even download the raw data and work with it yourself to present your own graphs or figures. Truly amazing.
We remember feeling like this when we first realised we could get our hands on raw gene expression data. What a powerful tool to contextualise your own work.
So if, for instance, if you are doing a study on HIV, and you need to know what the AIDS death rates are in various African countries, it would take two minutes to get this chart:
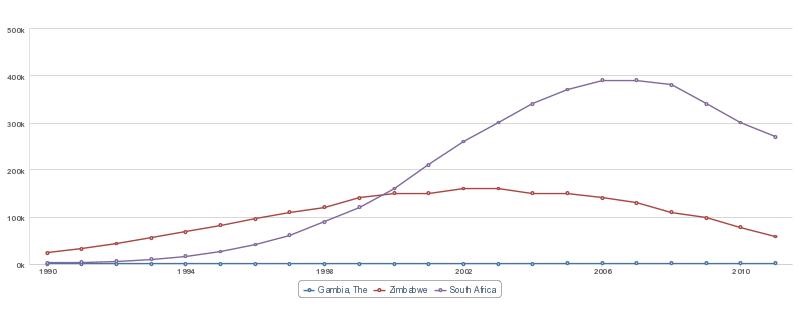
which you can then fully customise. So much better than some outdated and over-cited WHO data, don’t you think? You can then get a first-hand grip on the numbers, trends, and associations relevant to your own research.
The World Databank provide the following video tutorial, so please check it out:
We strongly recommend you go and have a play with this fabulous resource and see if it is useful for you. It’ll be particularly useful for students looking for thesis data. And please let us know what you think by commenting below.
comments powered by Disqus
What we hadn’t realised until very recently was that the same can be done for epidemiological data. We are currently planning our Nextgenediting Global Initiative (for more information click here), and while researching health and income statistics of third-world countries we found the World Bank World Databank. This is a free, online database of Development Indicators, Gender Statistics, and other useful data, which you can mine and interrogate at will for hundreds of different countries - both developed and otherwise. Most exciting for us however, is the Health, Nutrition, and Population Statistics Database which allows you to mine health and disease-related data. You just choose your country or countries of interest, the data series you want, and the range of years you are comparing (from 1961 to present) and the results are presented as tables, graphs, or on a map. You can even download the raw data and work with it yourself to present your own graphs or figures. Truly amazing.
We remember feeling like this when we first realised we could get our hands on raw gene expression data. What a powerful tool to contextualise your own work.
So if, for instance, if you are doing a study on HIV, and you need to know what the AIDS death rates are in various African countries, it would take two minutes to get this chart:
which you can then fully customise. So much better than some outdated and over-cited WHO data, don’t you think? You can then get a first-hand grip on the numbers, trends, and associations relevant to your own research.
The World Databank provide the following video tutorial, so please check it out:
We strongly recommend you go and have a play with this fabulous resource and see if it is useful for you. It’ll be particularly useful for students looking for thesis data. And please let us know what you think by commenting below.
comments powered by Disqus